

According to the graphs on OpenStreetMap's wikipedia page, OpenStreetMap has 1.3 million users. Indeed, back in January 2013 there were many stories reporting the breaking of the "1 million users" threshold. And equally there were many voices complaining that this magic number was meaningless because many of those "users" had never contributed anything! So what did it actually mean, if anything?
There's a good summary of the interpretations on Harry Wood's blog, discussing the meaning here of "user". Does it mean someone who uses OpenStreetMap? Surely not, because there are countless (and practically uncountable) people using the OpenStreetMap maps without ever registering at all. Probably there are much more than a million people just using the website. So it's 1 million "registered users" then, what does that mean?
Is it the number of contributors? No, because it has been shown by various studies (including an excellent 2012 paper for the ISPRS by Pascal Neis and Alexander Zipf) that less than a third of those "registered users" had actually submitted a single changeset. Even then, it's likely that many of the "contributors" don't actually contribute any more. Maybe they just submitted one changeset back in 2005 (to fix their own street name) and never came back. Are they still a "contributor"? Certainly not an "active contributor". Their own graphs show around 20,000 users editing nodes in any given month, but that is probably a low estimate of the active contributors, as many contributors won't edit every month, and might not only edit nodes (for example they may be concentrating on relations).
Another issue is the much-debated licence change OpenStreetMap decided to implement in 2012. I was curious whether this had a noticeable impact on the number of contributors. Certainly any contributor who did not explicitly agree to the new licence terms (whether deliberately or just because they were no longer involved) became blocked from contributing, yet OpenStreetMap's official "number of users" statistics still counted them! You can't legitimately sing your own praises about how many users your project has, when your project has blocked some of those users you're counting. So I became curious to see whether this number was significant or not.
The aim is to take apart this number of users (currently around 1.3 million users at the end of June 2013) and break it down into:
Still the count of accounts might be more than the count of people, and accounts include redaction engines, repair bots and import scripts (as well as vandals), but it's still a useful metric. And more importantly, is this number changing? Is the growth really so explosive as shown for example by this graph of registered users on the OSM wiki, or this graph on wikipedia. Also, was the number of active contributors affected by the licence change, did many contributors stop at this time, or was the impact negligible?
Rather than looking at the current planet, and seeing which users last edited particular objects, I decided to look at changesets. This way, I'm not just looking at node edits, and I'm also considering users who are not the most recent editor of an object. Hopefully this is a fairer way of seeing all contributions.
The first thing we can do is just count the changesets - thereby treating all of them as equal. Whether a changeset affects just the tags on one node or created dozens of new ways, they all just count as one changeset. For each one, we know the user id, and the timestamp. So we can easily see if the number of changesets is increasing or decreasing over time. We can look at all the submitted changesets from the very first one in April 2005 (user="Steve" uid="1") up to the end of June 2013.
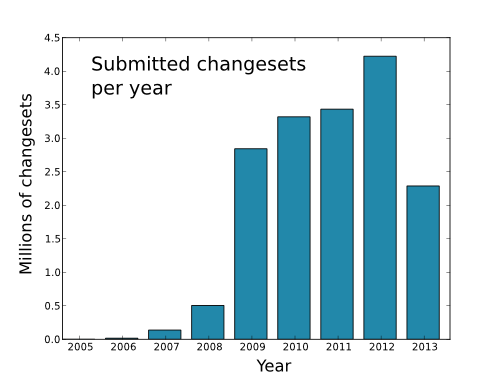 Submitted changesets per year (only half the year for 2013) |
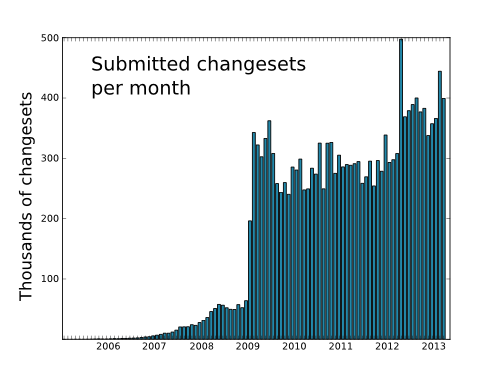 Submitted changesets per month |
These charts do indeed show an explosive growth in activity, especially during 2009, and a continual increase in the number of changesets being submitted. Whether they are imports, or redactions, or bot scripts, is of course still unknown, but the numbers of edits are huge and sustained. The yearly chart only contains changesets from the first half of 2013, which is why the bar for 2013 looks smaller, but in fact the rate is undiminished, as can be seen in the monthly chart.
The spike for the month of July 2012 is very obvious, and this corresponds exactly with the running of the "OSMF Redaction Account" which submitted over 135,000 changesets as part of the licence change. In the months after this redaction, the activity is noticeably higher than before, perhaps indicating efforts to clean up, repair and replace the data. In the first half of 2013, the edit rate is still at record levels, indicating that the licence change did not cause a reduction in activity.
Firstly, we can look at the whole time range from April 2005 to the end of June 2013, and just count the unique user ids. This gives us 347,662 contributors, out of a total reported number of users of around 1,285,000. So that confirms roughly 27% of these "users" have contributed something. Given that previous studies from 2011 and 2012 brought higher percentages than this, it appears that the dramatic increase in the number of registered users over the last year or two consists mostly of empty, dead accounts which have never contributed anything. It would be interesting to ponder why this fraction is increasing rather than decreasing. Maybe automatic registration of spam accounts has increased?
It's worth noting here that we're completely ignoring the "anonymous" contributions which don't have an associated user id. The main reason for this is that the numbers are vanishingly small. There were only significant numbers of anonymous changesets in 2005, 2006 and 2007, when the total changeset counts were much lower than in later years. The last anonymous changeset was submitted in 2010 and it is no longer possible to submit them. The total number of anonymous changesets ever submitted is around 9,000, which is currently only around 0.05% of all submitted changesets.
We can also count how many changesets each user has contributed. How common is it for a user to just submit one changeset and then never submit a second? In fact, 36% of these committers (10% of the registered users) has only ever made one edit, as we can see in the following pie chart.
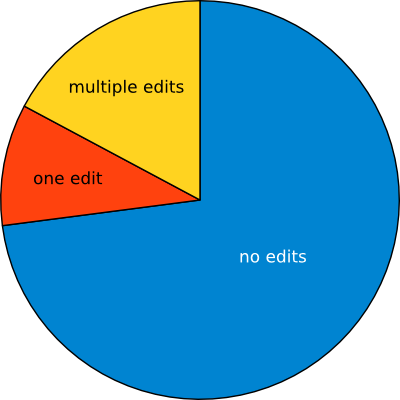 Submitted changesets per registered user |
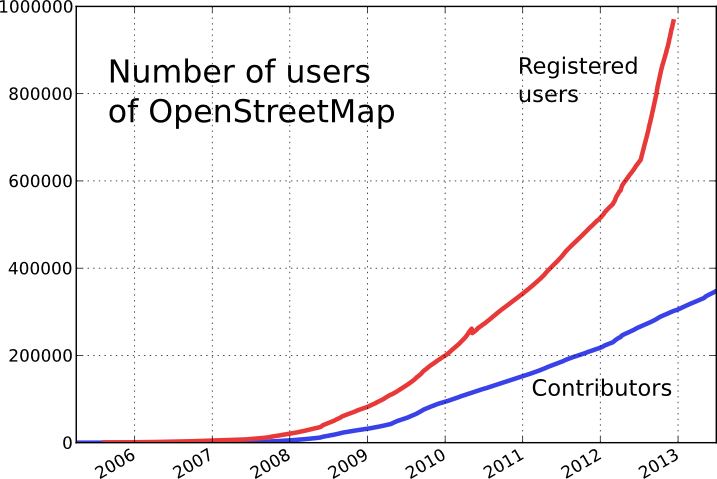 |
The second chart here shows the development over time of the number of contributors. Here again we just count the total number of unique user ids which have ever contributed up to the given time, just based on each user's first edit time. The upper line comes from OpenStreetMap's records of "registered users", currently only given until the end of 2012, shortly before they broke the 1 million barrier. Currently their claim is 1.3 million, which is way off the top of this chart.
Clearly, the numbers of "registered users" published (and celebrated) by OpenStreetMap bear very little meaning whatsoever. It's possible to say that OpenStreetMap has had around 350,000 contributors over its 8-year history, and that's an extremely impressive statistic in itself. Why they have to inflate it up to 1.3 million is a bit of a mystery.
We can split up the data into years, and show the number of unique users in any given year. Again, this shows that the number of contributors involved is increasing impressively and continually. And again, the number for 2013 is reduced because we're only dealing with half the year.
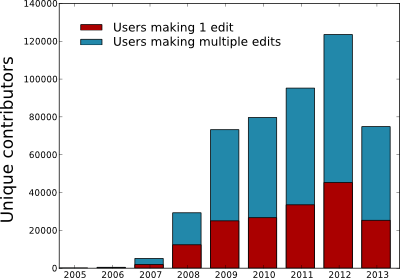 The number of unique contributors per year |
It's interesting to note that, no matter which year you look at, always roughly a third of the contributors only complete a single changeset. Whether these "single-use" users were just throwaway registrations deliberately just for one edit, or whether the users got frustrated or disillusioned is of course unknown. Just as it is unknown how many of the hundreds of thousands of registered users who have never contributed anything actually tried to contribute something but failed. Perhaps the new note-making facility of OSM will reduce the need for throwaway accounts, as errors can now be highlighted without needing a registration.
For the same data for rolling months, see these graphs on their wiki, showing a peak of around 22,000 unique users per rolling month. I think the yearly figures are more appropriate for judging how many people are involved though, also counting those who only contribute occasionally. In this case that gives 123,500 contributors over the whole of 2012, of whom 45,000 contributed just a single changeset in that year.
As already discussed, not all of these 350,000 contributors are still involved. Some have left, and some got blocked with the licence change. Now the difficult question is, how long ago does the last edit have to be in order for the contributor to be deemed "active"? Last week? Last month? Last year?
Let's be generous and count the users who have contributed in either 2012 or 2013. We assume that if anyone is still actively involved in OpenStreetMap, they would have submitted at least one changeset some time in the last 18 months. The number of contributors now drops to 171,705, or 49% of the contributors. So we can again break down the "registered users" into never active, previously active and currently active.
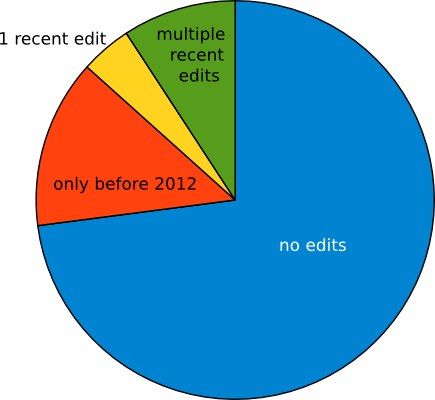 When the edits from each user were made |
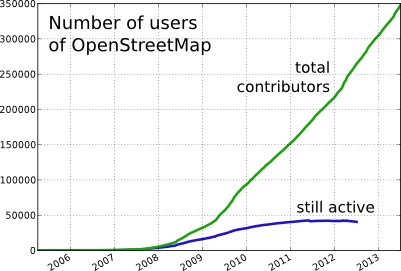 |
We can go further and find out also each user's last edit date. For example, if the user last contributed a changeset in 2008, we can say that they were only active up until that date. Then we get the number of "really active" contributors between their first and last contributions. For 2012 and 2013 we don't expect the numbers to be meaningful, but we can see what we get for the earlier years.
The result is shown above, comparing the "total contributors" (users who have contributed ever) to "still active" contributors (users who have made their first contribution and haven't yet made their last). As expected, many users are involved but only a small fraction of those are active over extended periods. This line is surprisingly low, probably due to the large number of contributors who only make one changeset. For them, their start date and end date are the same, so they don't appear to be "active" on this line. This however is unfair, because they're still making valuable contributions to the maps and the sum effects of large numbers of such contributors is essential.
We can look at the first and last contributions for each user and see when they started and when they stopped contributing. Going back to the licence change, it would be interesting to see if more people than usual stopped contributing at that time (because they were now blocked) or whether more people joined at other times.
First of all, we can look at the number of users joining, and we see a smallish peak in the second half of 2009, a bigger spike in early 2012, but nothing really dramatic inbetween. Nothing in July 2011 when users were blocked, nothing in July 2012 when the redaction bot was run, and not much afterwards except healthy recruitment.
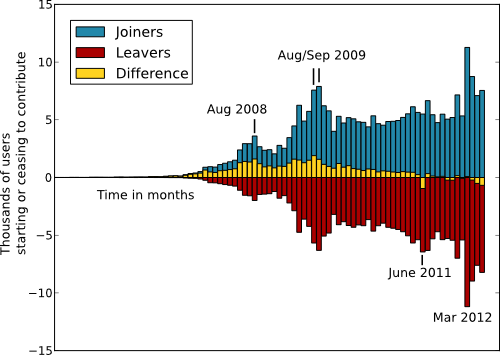 Users joining and leaving per month (yellow is the difference) |
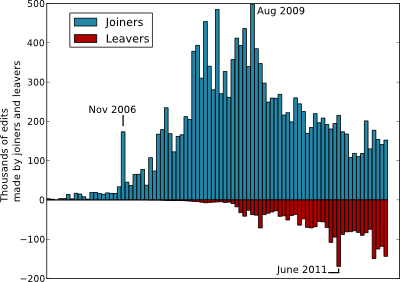 Total changesets submitted by joiners and leavers |
For the numbers stopping contributing, it's again a similar picture, with peaks around the same times as the joining peaks - perhaps with many editors just contributing for a single month or two. It's only when you look at the difference between these two values (the net gain in contributors) that you see the little yellow spike going below the axis in June 2011. At that time, the first month ever with a net decrease and still the biggest net decrease in contributors.
Yet even this seemingly significant event (when all users who didn't agree with the changes to the licencing and terms & conditions were blocked permanently from editing) is difficult to find in the data and the numbers involved are small compared to the normal month-to-month variation.
On the other hand, perhaps the users blocked at this time were particularly productive ones? Maybe if we multiply each user by the number of changesets he or she made, then we'd see the effect of blocking enthusiastic contributors rather than just casual ones?
Well, the answer to this is in the second chart. Yes, there is a noticeable departure of contributors in June of 2011, when users started being blocked from contributing. But again, this number is still small compared to the numbers of people joining both before and after this date. And those joiners went on to make sizeable numbers of changesets themselves,
We've seen that there is no single answer to "the number of contributors to OSM". But for sure it's not 1.3 million. If you strictly look at users who are "still active", you get only around 50,000, which is too low an estimate. If you take all the users who have ever contributed, you get around 350,000 which is too high as it includes all sorts of people who have left. So a meaningful value is somewhere inbetween. Taking just those users who contributed in 2012 and the first half of 2013, you get 170,000 contributors which is probably again too high. Around 75,000 users contributed in the first half of 2013, but perhaps that estimate is again too low - not all users contribute every 6 months.
After all that, the only number that is difficult to argue with is the total contributors, 350,000, and that's a spectacular number. They're the users who have contributed something to make OpenStreetMap as complete and accurate as it is. Hats off to you 350,000, and I hope that number actually does reach 1 million some day. But until then, saying that OSM has 1.3 million "registered users" is like saying it has 1.3 million bananas.
The other question I wanted to investigate here was the effect of the licence switch. But in these numbers there is very little sign of any reduction of changeset submissions or reduction in users. There are tiny blips visible if you look hard enough at those charts but they're really small numbers. Perhaps the number of users who disagreed with the licence switch (and were then blocked from contributing) really was small enough to get lost in the data flood. In which case, hats off also to those performing the switch, it was painful for everybody but doesn't appear to have significantly affected the contributor base or their mapping activity.